Technical Guide: How to Design an SRE Framework for GKE Microservices (with Pub/Sub & GCS)

When deploying critical business logic onto , defining “uptime” can get complicated fast. If your containerized application crashes but your message queues are still buffering incoming traffic safely, is your platform actually down?
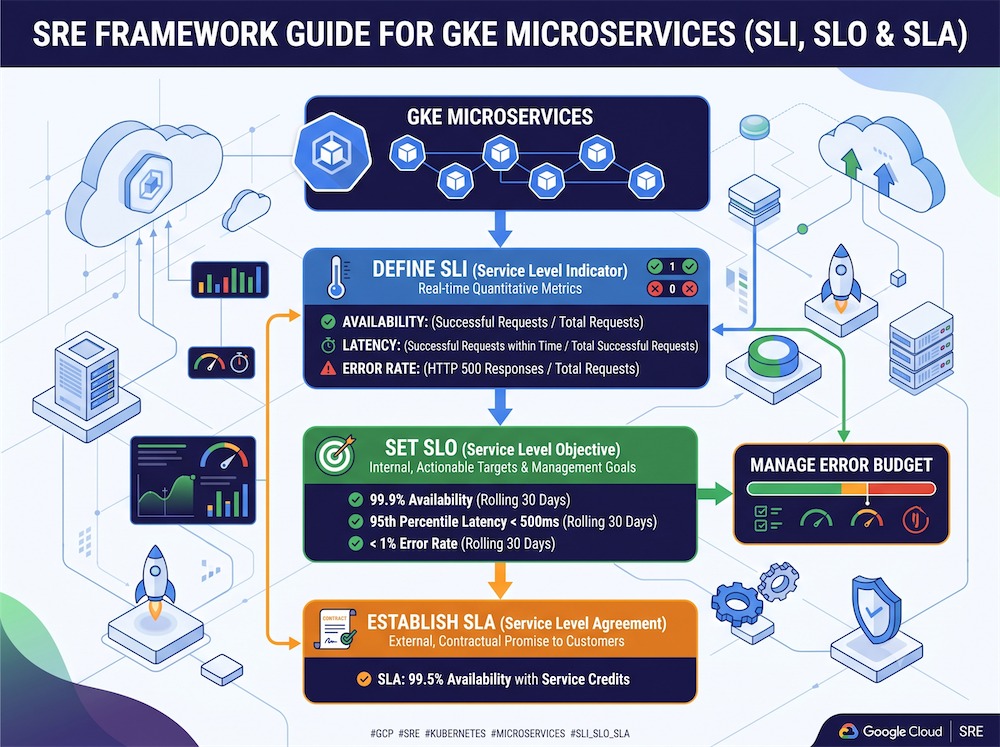
To build a truly resilient software platform, you need a unified data vocabulary shared between engineering, product managers, and executive leadership. This comprehensive guide breaks down how to calculate, configure, and define Service Level Indicators (SLIs), Service Level Objectives (SLOs), and Service Level Agreements (SLAs) for a cloud-native microservice running in the us-central1 region backed by Cloud Pub/Sub and Cloud Storage (GCS).
A single microservice rarely performs just one task. To measure cloud reliability accurately without creating alert fatigue, you must split your system architecture into two distinct Critical User Journeys (CUJs):
- Synchronous Web Traffic: Real-time HTTP/gRPC API requests hitting your GKE ingress and routing to application pods.
- Asynchronous Data Pipelines: Event-driven background processing that consumes streaming data from Pub/Sub topics and outputs batch files into Cloud Storage buckets.
Service Level Indicators (SLIs) are the raw operational data points showing how your cloud architecture is performing in real-time. Site Reliability Engineering (SRE) industry best practices dictate formatting SLIs as an explicit ratio: (Good Events / Total Valid Events) × 100.
🖥️ Journey 1: Synchronous API Traffic Metrics
1. Availability SLI Formula
The percentage of valid HTTP requests handled successfully by your GKE workloads. We deliberately isolate internal server-side runtime errors (5xx) from standard user behavior.
X 1002. Latency SLI Formula
The percentage of total API requests that complete processing faster than your defined application performance threshold (e.g., 200 milliseconds or 0.2s).
X 100⏱️ Journey 2: Asynchronous Event Processing Metrics
3. Pipeline Freshness (Queue Age) SLI Formula
For asynchronous background workers, counting HTTP status responses will not track performance issues. Instead, measure the maximum age of unacknowledged pipeline data inside Cloud Pub/Sub to ensure your system isn’t lagging during traffic spikes.
SRE Implementation Tip: In your , natively track this pipeline data using the :// platform metric.
Your Service Level Objectives (SLOs) are the precise, internal engineering targets your DevOps team aims to maintain. To protect against temporary anomalies, calculate these numbers over a rolling 30-day window.
| Critical User Journey / Metric | SLI Mathematical Specification | 30-Day Rolling SLO Target | Monthly Error Budget (Allowed Failure Space) |
|---|---|---|---|
| User API Availability | Successful responses / Total valid requests | 99.9% | 0.1% (~43.2 minutes of total downtime) |
| User API Latency | HTTP response time ≤ 200ms | 95.0% | 5.0% of total requests can be slow |
| Pub/Sub Processing | Oldest unacked message age ≤ 10s | 99.0% | 1.0% of backlog processing time |
🛡️ How to Enforce the Error Budget Policy
If your microservice encounters a critical outage or a memory leak that burns entirely through its 0.1% availability error budget, it automatically activates your SRE team’s Feature Freeze policy.
Under this framework, application developers pause shipping new application capabilities to production. Instead, they shift 100% of their operational velocity toward structural bug fixes, code optimization, and clearing out technical debt.
Your Service Level Agreement (SLA) is the formal contract you sign with your paying enterprise clients. Breaching an SLA results in real financial consequences, such as issuing invoice refunds or service credits.
🏗️ The Infrastructure Dependency Reality Check
When designing your external SLA, never promise higher uptime than your underlying infrastructure dependencies. Because this microservice architecture is deployed in us-central1, your software uptime is strictly bounded by Google Cloud’s infrastructure service agreements:
- GKE Regional Control Plane SLA: 99.95% availability
- Cloud Pub/Sub SLA: 99.95% availability
- Cloud Storage (GCS Standard Regional) SLA: 99.9% availability
📝 Recommended Enterprise Application SLA Template
Because our internal engineering goal (SLO) is set to 99.9%, our external contract (SLA) must include a safety buffer. We recommend setting your legally binding contractual commitment to 99.5%.
### 1. Core Service Commitment
The Microservice framework guarantees an Uptime Availability Rate of ≥ 99.5% during any given billing calendar month.
### 2. Measurement Exclusions
Uptime performance is verified at the GKE Ingress controller boundary. Outages stemming directly from global Cloud Pub/Sub routing failures or multi-zone regional Cloud Storage faults originating entirely within Google Cloud data centers are excluded from penalty calculations.
### 3. Financial Service Credits
If the tracked Monthly Uptime drops below the target percentage, customers are eligible to receive invoice credits:
* Monthly Availability < 99.5% but ≥ 99.0%: 10% Service Credit applied to the monthly bill.
* Monthly Availability < 99.0%: 25% Service Credit applied to the monthly bill.
- SLIs calculate your precise technical data.
- SLOs enforce internal team discipline using rolling error budgets to balance speed and platform safety.
- SLAs protect your business from legal liabilities by keeping contractual uptime promises realistic.
By tightly linking these three operational layers together, you protect your system engineers from alert fatigue while providing a transparently stable software product to your end users.