Multi-Tenant Elastic Architecture: How to Scale to 50+ Business Units Safely
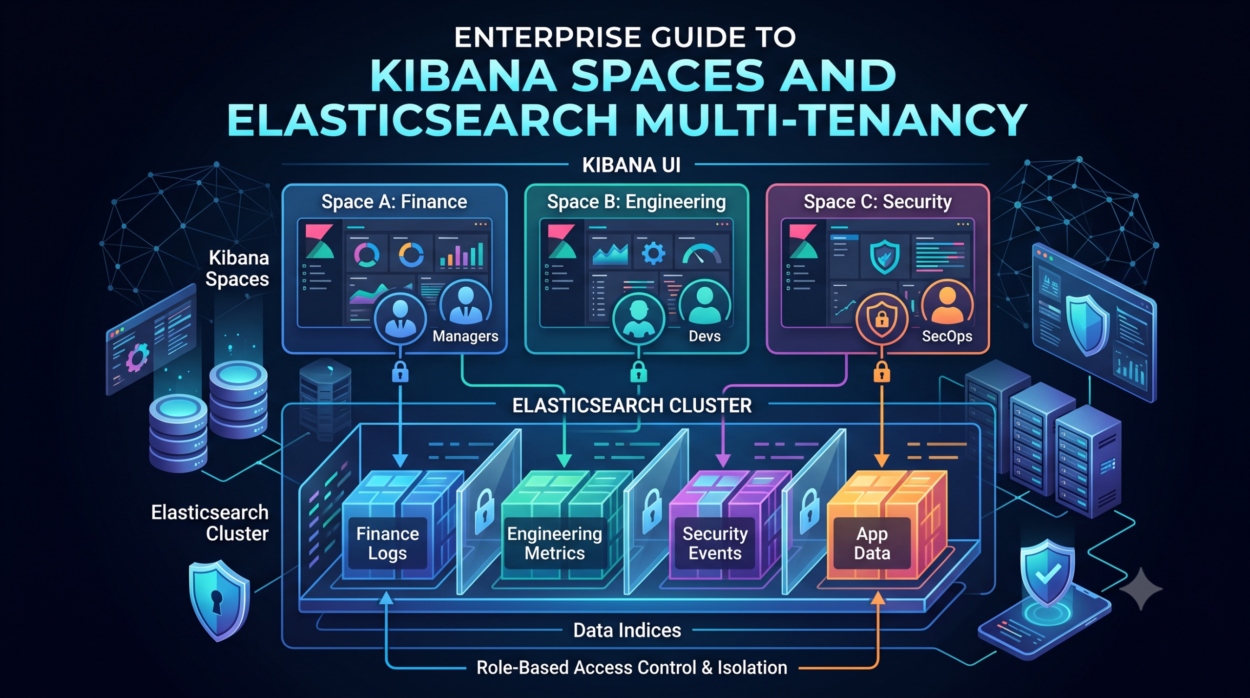
Managing a centralized log and metrics platform for an enterprise with dozens of business units is challenging. When teams rely on a single platform, coordination becomes difficult. Kibana Space helps organize spaces for different groups, improving governance. This structure supports audits and cross-team collaboration.
Visual dashboard clutter slows analysis and hides critical trends. Accidental configuration overwrites threaten stability and compliance with sensitive data like PCI-DSS. Unclear infrastructure cost attribution complicates budgeting.
If your first instinct is to spin up 50 distinct physical Elasticsearch clusters, stop right there.
Building isolated infrastructure for every department creates an operational nightmare. It fragments your data engineering resources, and it skyrockets cloud spend. Instead, the industry standard is to deploy a single, resilient Elastic platform and partition it using a three-tier multi-tenancy model. This approach aligns with Kibana Space and preserves centralized control.
Here is the exact blueprint to architect a clean, secure, and cost-transparent enterprise platform.
1. Clean Up the User Interface with Kibana Spaces
Placing 50 separate engineering teams into the same default Kibana Space dashboard environment causes immediate friction.
Teams will inadvertently delete each other’s visualizations, and finding a specific dashboard becomes an exercise in frustration.
The first layer of isolation happens at the presentation layer using Kibana Spaces.
Think of Kibana Spaces as custom virtual apartments inside one large apartment building:
- Logical Workspace Isolation: You provision dedicated spaces aligned with business verticals or domains (e.g., space-payments, space-logistics). Inside their assigned space, teams customize dashboards, saved objects, and alerts without interfering with anyone else.
- Shared Performance, Zero Overhead: All spaces leverage the same underlying Elasticsearch data cluster. There is zero hardware overhead or extra infrastructure to maintain.
- Tailored UI Experiences: If your logistics team only needs APM metrics and basic dashboards, administrators can toggle off advanced developer tools or security applications strictly within that space to declutter the sidebar.
2. Secure Data Access with Identity Mapping, DLS, and FLS
While Kibana Spaces clean up what users see on the screen, they do not secure the underlying data layer. To ensure strict data privacy and zero-trust security, you need robust backend guardrails.
Instead of manually onboarding thousands of enterprise employees, map your corporate identity provider (SAML, OIDC, Active Directory, Azure AD, or ) directly to Elastic roles. Once identity mapping is established, you can enforce security down to the individual document and field level.
Document-Level Security (DLS): Who Can See What Rows?
DLS restricts document visibility using Lucene query scopes. For example, when a retail banking analyst queries the global log stream, the backend implicitly injects a filter ensuring they only see logs matching their specific tenant ID.
{
“indices”: [
{
“names”: [“logs-*-*”],
“privileges”: [“read”],
“query”: “{\”term\”: { \”tenant.id\”: \”retail-banking\” }}”
}
]
}
Field-Level Security (FLS): Masking Sensitive Data for Compliance
To maintain PCI-DSS or GDPR compliance, you must prevent unauthorized eyes from seeing Personally Identifiable Information (PII). FLS acts as an automated blackout marker. It can grant full access to general metadata fields while explicitly blacklisting sensitive strings like credit card numbers or Social Security Numbers (SSNs).
{
“indices”: [
{
“names”: [“logs-payments-*”],
“privileges”: [“read”],
“field_security”: {
“grant”: [“*”],
“except”: [“payment.card_number”, “customer.ssn”]
}
}
]
}
3. Implement Chargeback and Showback Ingestion Governance
When running a massive, shared cluster, individual business units must have clear visibility into their resource consumption. You cannot sustain a centralized platform model long-term without an objective cost attribution system.
solves this seamlessly by tracking data stream statistics out of the box. By querying the cluster’s data stream endpoints, you can track exactly how many ingestion bytes each department consumes:
GET /_data_stream/logs-*/_stats
Automating Cost Attribution
To turn raw bytes into actionable business intelligence, platform teams can deploy a simple automated script or an internal audit dashboard:
- Daily Footprint Tracking: The automation reads the metadata byte counts per data stream every 24 hours.
- Granular Breakdown: The script groups ingestion volume by explicit metadata tags like or tenant.id.
- Monthly Financial Models: At the end of the billing cycle, the system generates custom cost attribution reports, allowing you to easily bill back cloud infrastructure spend to the corresponding business units based on actual usage.
Summary: The Blueprint at a Glance
| Security & Governance Strategy | Implementation Tier | Core Business Value |
|---|---|---|
| Kibana Spaces | Presentation / UI Layer | Eliminates clutter; customizes user experiences. |
| Document-Level Security (DLS) | Row-Level Data Layer | Isolates tenant datasets automatically within shared indices. |
| Field-Level Security (FLS) | Column-Level Data Layer | Redacts PCI-DSS/PII data to ensure compliance. |
| Data Stream Stats Integration | Infrastructure Governance | Provides accurate data to drive monthly chargeback models. |
By separating the visual workspaces, strictly enforcing data-level compliance, and implementing transparent consumption tracking, you can scale a single Elastic deployment to support over 50 business units efficiently, securely, and cost-effectively.